The title of 'Data Scientist' is one of those sexy, evolving, roles that no-one seems to be able to characterize definitively. More accurately: just about everyone has their own definition. If you ask four practitioners in the data space, you’ll get five opinions on what a data scientist is and does.
These range from the flippant ("a statistician that lives in California") to the vaguely heuristic ("someone who is better at statistics than any software engineer and better at software engineering than any statistician"). Yet these definitions share traits. A fair level of programming is expected, as are statistics and math skills. Some emphasize business domain knowledge, while others value communication skills.
Attempts to clarify the varied definitions are also numerous; the most perfunctory search will uncover a deluge of diagrams and a redundancy of road maps[1]. The title itself shouldn’t really matter, and many argue the term has become diluted beyond usefulness. And yet it doesmatter. Despite the rampant vagaries, this occupation has been rated the top job in America for the last three years, famously hailed as 'one of the sexiest jobs of the 21st century'[2] It's a hot field.
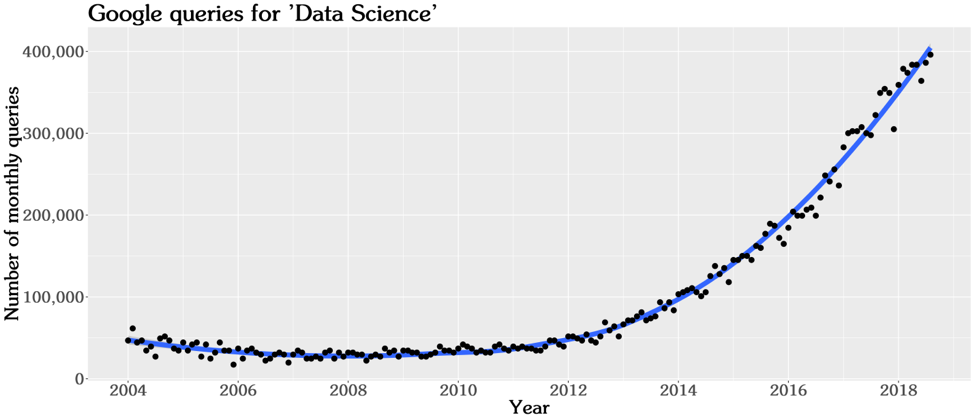
The fact is there is exponentially growing awareness within the business community that they can leverage tangible profits from their own — and others' — data. This interest is reflected in the increasing rate the topic has been queried on Google:
Figure 1: The rapidly growing awareness and interest in Data Science. Each point is the global monthly query count for ‘data science’ or ‘data analytics’ via Google's search engine. Data from Google Trends (https://trends.google.com/trends/).
The Difference Between a Statistician and a Data Scientist
To give some background, the essential notion of data science has been around for some time. The imitable John Tukey[3] emphasized the empirical heart of data analysis, as opposed to plain statistics, in 1962: "For a long time I thought I was a statistician, interested in inferences from the particular to the general. But […] I have come to feel that my central interest is in data analysis. Data analysis, and the parts of statistics which adhere to it, must then take on the characteristics of a science rather than those of mathematics […] data analysis is intrinsically an empirical science."
This insistence onempiricismis a key defining feature of data science and distinguishes it — in principle — from the perhaps more passive roles of the traditional analyst or statistician[4]. To refresh you on the principles of the scientific method:
Conduct careful observations of the system in question
Filter these observations, considering pre-conceived assumptions or hypotheses
Apply logical induction on the observations to formulate new hypotheses
Experimentally measure and test the logical consequences of these hypotheses
Based on the results of the above analysis, eliminate or refine the new hypotheses
Implied in this prescription is that the process of constantly refining hypotheses eventually grants the ability to influence, exploit, or even control the system being studied. In the context of the physical sciences, for example, there was a progression from noticing that radioactive ore left in a drawer results in funny photos of your bones, to the capacity to build the most destructive weapons in history.
For better or worse, the ability to construct thermonuclear weapons came from an iterative refinement of scientific ideas originating from the careful observation of glowing rocks. In a business context, the ultimate goal — the thermonuclear advantage — has to do with the bottom line. Put baldly: the system under study by the data scientist must have the potential to improve the financial state of the business, or they are wasting their time.
And therefore, perhaps the most important skill required of a data scientist is that of communication.And, equally important, whom is being communicated with. Ineffective communication means that the data scientist cannot influence the system they have so carefully studied. No one cares about your fancy machine learning model if it's unclear that it will benefit the business.
In summary: a data scientist is certainly defined by possessing a broad range of technical skills including programming, math and statistics. But the most important skills are that of applying the scientific method to an important business problem — which requires some domain knowledge of the business — and communication of the results of this inquiry.
Not surprisingly, a succinct definition of a Data Scientist has eluded us here. Perhaps it’s like the culture of the 1980s — only with the benefit of hindsight will we really understand what was going on! If you would like more specific details on how to achieve a high value analytics program as described above, we systematically cover this in our Analyzing Big Data with R Programming and Data Science and Analytics courses.
Meta-epilogue
If you found this article via a search engine, then it very likely is the month of September. More precisely, if you are in the USA, you are over five times as likely to search for 'What is a Data Scientist?' in September than in June.
You can see the variation around the trend quite clearly here:
Figure 2: variation around a clear seasonal trend of searches on Google for ‘What is a Data Scientist?’ This seasonality is most clear for US only searches.
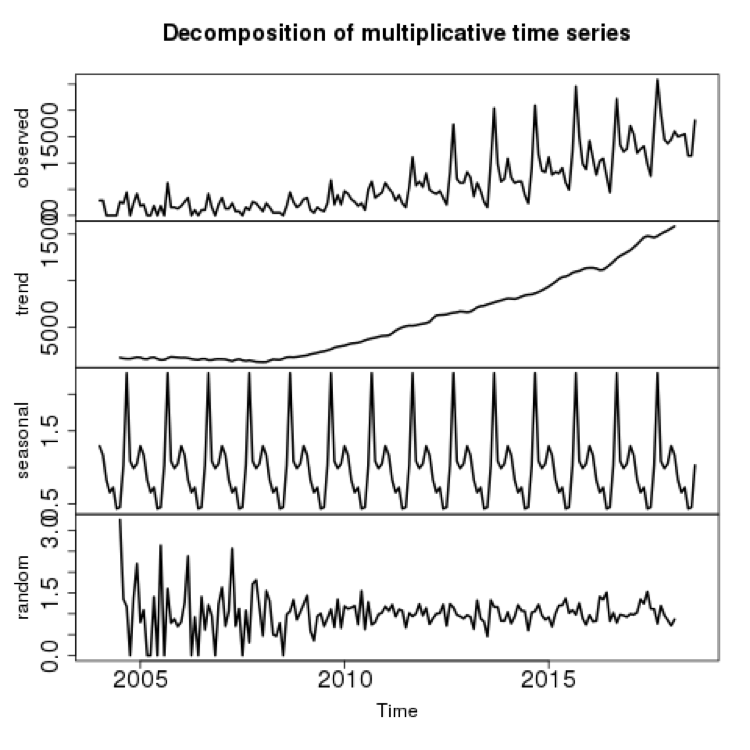
While there is a clearly rising rate of searches for this topic, there is an equally clear seasonal variation. We can give a more technical analysis of this by removing the trend and looking at the remaining periodic variation:
Figure 3: decomposition of underlying trends and seasonal variation for ‘What is a Data Scientist?’ searches on Google.
Wow. This is very clear.
The top panel ('observed') is the original data, from Google Trends. The second panel ('trend') is a variation of the polynomial smoothing you saw in the previous plot. The striking periodicity in panel 3 ('seasonal') shows that there is a yearly repeating pattern in the rate of searches. The residual noise, panel 4 ('random') shows that the relative signal to noise ratio increases greatly over time.
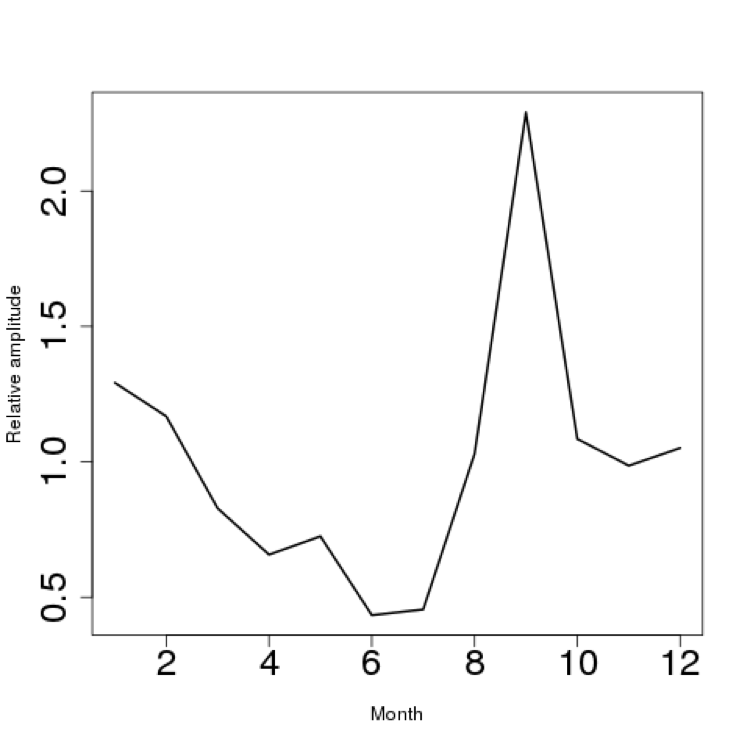
Finally, a close-up of the seasonal variation shows that the peaks (local maxima) occur in September, and the troughs (local minima) occur in June.
Figure 4: Periodic chart of where peaks and troughs occur for Google searches for ‘What is a Data Scientist?’ The sharp peaks occur in September, while a shallower trough occurs around June each year.
Almost certainly this has to do with the US college year: the summer vacation months show an ebb, while the start of the Fall[5] semester is generally around the beginning of September each year.
If you are interested in how to perform this seasonal analysis decomposition, it is fairly straight-forward to do this in the R language for statistical computing. The code for this can be found here.
[1] A hint for navigating these: the Venn diagrams with three external circles miss at least one important sphere of skills, while those with more become cluttered. The road maps rapidly date themselves, so pay close attention to when they were produced!
[2] Davenport, Thomas H., and D.J. Patil: "Data Scientist: The Sexiest Job of the 21st Century," Harvard Business Review 90(10): 70–76(October 2012).
[3] Aside from coming up with the game-changing Fast Fourier Transform (FFT) algorithm, jackknife resampling, and the boxplot, he coined the word 'bit' in computer science (short-hand for 'binary digit').
[4] Of course, this is all changing, so the distinction is rapidly disappearing.
Ra is originally from New Zealand, has a PhD in physics, is a data scientist, and has taught for Accelebrate in the US and in Africa. His specialties are R Programming and Python.