How to Create a Hello World R Visual in Power BI

We offer private, customized training for 3 or more people at your site or online.

If you want to go beyond what is available in Power BI through DAX and the standard and custom visuals, you may want to experiment with R transformations, calculations, machine learning, and charts. This is how to create a very basic R visual in Power BI:

Steps:

  1. Check you R installation. Open your favorite R editor, for example RStudio. Check the path to your R installation – you might need this is step 2. In RStudio, click Tools, Global Options… and look at General, R version. Try this next R snippet to check a built-in dataset and display a chart:

    code snippet


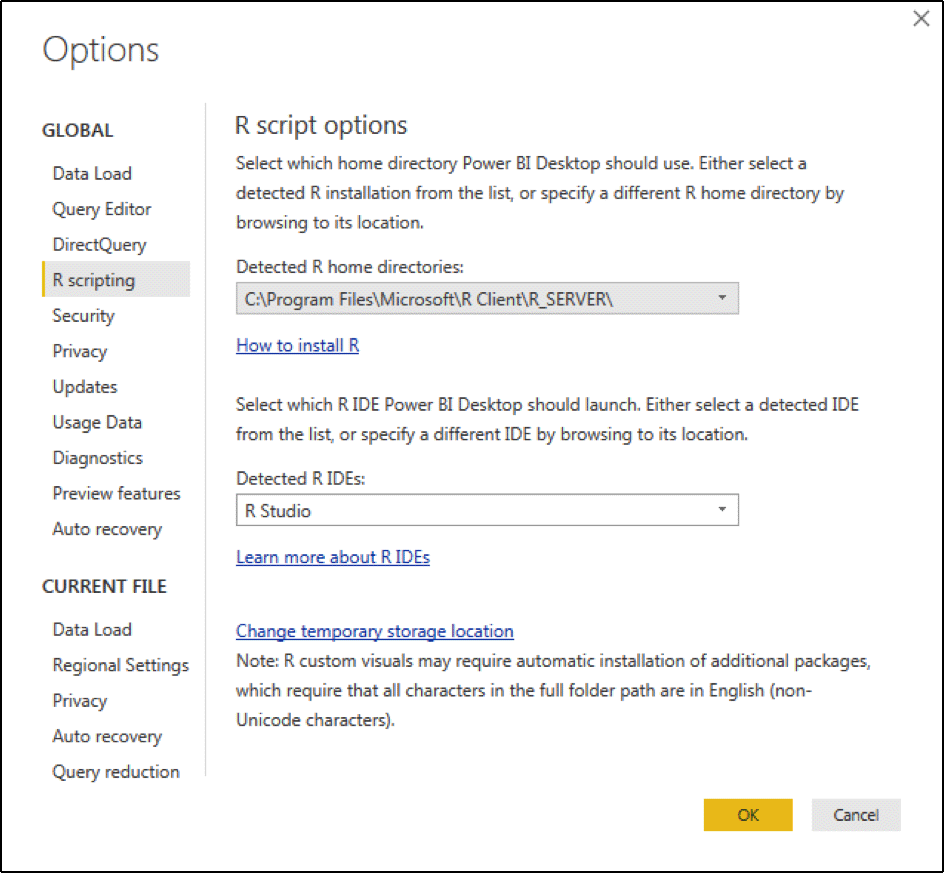
  2. Enable R in Power BI Desktop. Click the drop-down just to the left of the Home tab in Power BI Desktop. Then choose Options and settings, Options, R scripting (under GLOBAL). The Detected R home directories: may already be pointing to the path in step 1. If not, click Other, then Browse and navigate to the correct R directory. Click OK when done.

    enable R in Power BI


  3. Create a dummy table to activate the R script visual in Power BI Desktop.
    1. On the Home tab, click Enter Data, then Load. This creates a table called Table1 with a column called Column1 that contains no data!
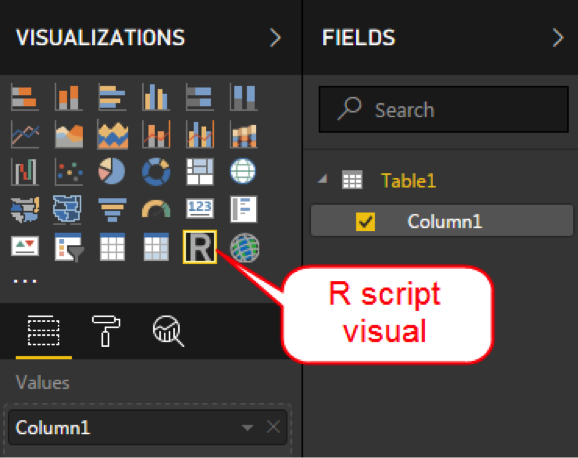
    2. Click the R script visual icon under Visualizations and Enable.
    3. Click Column1 under Table1 in Fields. Column1 should appear in the Values section under Visualizations and the R script editor will be activated with a data frame called dataset.
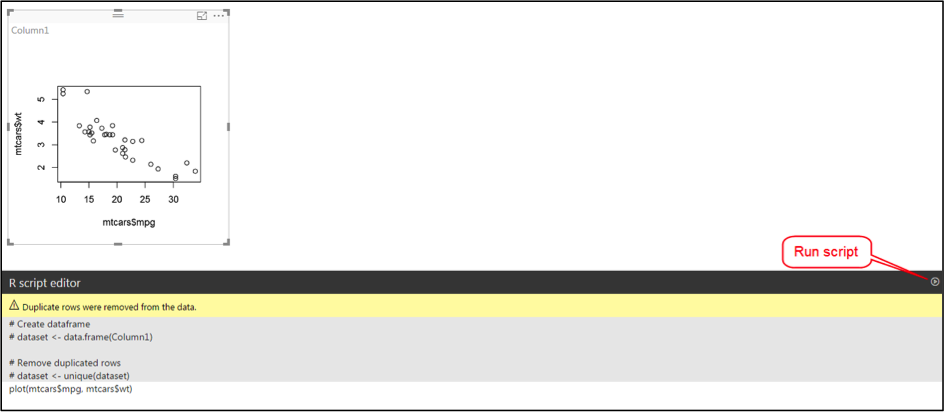
    4. In the editor enter plot(mtcars$mpg, mtcars$wt) and click the Run script button.

      run the script

      R script visual


  1. Save your pbix file and publish to PowerBI.com. Both save and publish are in the drop-down just to the left of the Home tab. You can now view and share your R visual. It is visible in your report in PowerBI.com, if you pin either the visual or the whole report to a dashboard. If you share the report or the dashboard it will also be visible to other users. As I write (January 2018), it will not yet work in Publish to Web or in Power BI Report Server.

  2. Next steps. This example is very simple! For more complex visuals I recommend R Graphics Cookbook by Winston Chang. And this example used a built-in dataset, mtcars – try and use 'real' data by using columns from your own tables in the Values section, then you can derive plots based on the data frame called dataset.
Learn faster

Our live, instructor-led lectures are far more effective than pre-recorded classes

Satisfaction guarantee

If your team is not 100% satisfied with your training, we do what's necessary to make it right

Learn online from anywhere

Whether you are at home or in the office, we make learning interactive and engaging

Multiple Payment Options

We accept check, ACH/EFT, major credit cards, and most purchase orders


Recent Training Locations

Alabama

Birmingham

Huntsville

Montgomery

Alaska

Anchorage

Arizona

Phoenix

Tucson

Arkansas

Fayetteville

Little Rock

California

Los Angeles

Oakland

Orange County

Sacramento

San Diego

San Francisco

San Jose

Colorado

Boulder

Colorado Springs

Denver

Connecticut

Hartford

DC

Washington

Florida

Fort Lauderdale

Jacksonville

Miami

Orlando

Tampa

Georgia

Atlanta

Augusta

Savannah

Hawaii

Honolulu

Idaho

Boise

Illinois

Chicago

Indiana

Indianapolis

Iowa

Cedar Rapids

Des Moines

Kansas

Wichita

Kentucky

Lexington

Louisville

Louisiana

New Orleans

Maine

Portland

Maryland

Annapolis

Baltimore

Frederick

Hagerstown

Massachusetts

Boston

Cambridge

Springfield

Michigan

Ann Arbor

Detroit

Grand Rapids

Minnesota

Minneapolis

Saint Paul

Mississippi

Jackson

Missouri

Kansas City

St. Louis

Nebraska

Lincoln

Omaha

Nevada

Las Vegas

Reno

New Jersey

Princeton

New Mexico

Albuquerque

New York

Albany

Buffalo

New York City

White Plains

North Carolina

Charlotte

Durham

Raleigh

Ohio

Akron

Canton

Cincinnati

Cleveland

Columbus

Dayton

Oklahoma

Oklahoma City

Tulsa

Oregon

Portland

Pennsylvania

Philadelphia

Pittsburgh

Rhode Island

Providence

South Carolina

Charleston

Columbia

Greenville

Tennessee

Knoxville

Memphis

Nashville

Texas

Austin

Dallas

El Paso

Houston

San Antonio

Utah

Salt Lake City

Virginia

Alexandria

Arlington

Norfolk

Richmond

Washington

Seattle

Tacoma

West Virginia

Charleston

Wisconsin

Madison

Milwaukee

Alberta

Calgary

Edmonton

British Columbia

Vancouver

Manitoba

Winnipeg

Nova Scotia

Halifax

Ontario

Ottawa

Toronto

Quebec

Montreal

Puerto Rico

San Juan