We offer private, customized training for 3 or more people at your site or online.
After you have created your content, published your blog posts, and created your ads to reach your target audience, what is left to do? How do you know if any of that was effective? How can you find out if your content is reaching your audience successfully? These are the questions many companies must answer today. It is not enough to spend money to create an ad campaign or put content on your website; you also need to identify metrics that tie your actions or content to business outcomes.
One way to monitor the traffic or users to your website is through Google Analytics. If you already own a Google Analytics account, or any other tool for monitoring your web traffic, then you are probably aware of how easy it is to feel overwhelmed by all the data and reports to which you have access. Google Analytics alone gives you the option to select from over 20 or more different segments and dimensions, categories, and metrics. However, is this vast volume of data at all meaningful to your business?
In this tutorial, you will learn how to:
- Use Tableau to connect to your data in Google Analytics to pull just the information that is useful to your goals or objectives.
- Build meaningful charts that tie to your goals or objectives.
The best approach to analyzing your website traffic data is to start by evaluating your site performance. In this tutorial, some of the metrics you will analyze include:
- Sessions
- Session Duration
- Percent of New Sessions
- Bounce rate
- Goal Conversions
- New users
- Pageviews
- Unique pageviews
You can download a 14-day copy of Tableau Desktop as a trial if you wish to work along with this tutorial and do not yet have Tableau.
Accessing Google Analytics Data
- Launch your Tableau Desktop tool and under the connect pane, select "Google Analytics."

Tableau will automatically launch your default browser and present you with your Google account login page.
- Enter the Google account credentials linked to your website to allow Tableau to connect to data in your Google Analytics account.

- You will be prompted to allow Tableau to connect to your Google Account data. Select Allow.

Selecting the Desired Data
You should now see a window that looks as shown below:

This new window presents you with steps to pull the data you want to analyze within Tableau.
- Select your Account, Property, and Profile using the drop-down menus at the top left. This is useful when you have multiple accounts or profiles linked to your Google account.
- Filter the date range of your data based on the pre-defined filter list from the drop-down menu or specify the date range you want for your data.
- The Segment drop-down has pre-set filters where you can select the segment of users you want to analyze. These segments are created in Google Analytics. Some come standard from Google, others you create yourself. These get pulled into Tableau.
- Select the dimensions and measures you want to use in your analysis.
- For our purposes, we'll look at the same metrics we mentioned previously.

- Click Sheet 1 at the bottom left to begin editing within Tableau.
- Drag your Date dimension to the Column shelf and drag your Sessions measure to the Row shelf in your Tableau canvas.
- Change the drop-down menu on Marks at the left from Automatic to Area.

- By default, the date level-of-detail will be set to the year level. Hover on the date field and click on the drop-down arrow. Select Week Number.

- Now, right-click your metric axis and select Add Reference Line.

- In the window that pops up, select the Average option from Value and change the Label to Value.

Your chart should now look like this:

- Now that you have the area chart set up, let's include a line chart to make our chart pop. This step is so that our chart will have both the solid line at the top and the shaded in area below, which makes it look nicer. In your measure shelf, drag your Sessions metric again and bring it into the view as shown below.

You will now notice two charts on your canvas. On the Marks card you will notice that there are two instances of the Sessions metric displayed there as well.

- Select the second metric on Marks and in the chart options, select Line.

- Right-click the second Sessions measure in the Rows shelf and select Dual Axis.

Pay attention to your axes after using this feature. You will notice that they do not match after performing the dual axis.

You need to make sure both axes match; otherwise, your analysis will be incorrect.
- Right-click the right axis of the chart and select Synchronise Axis.
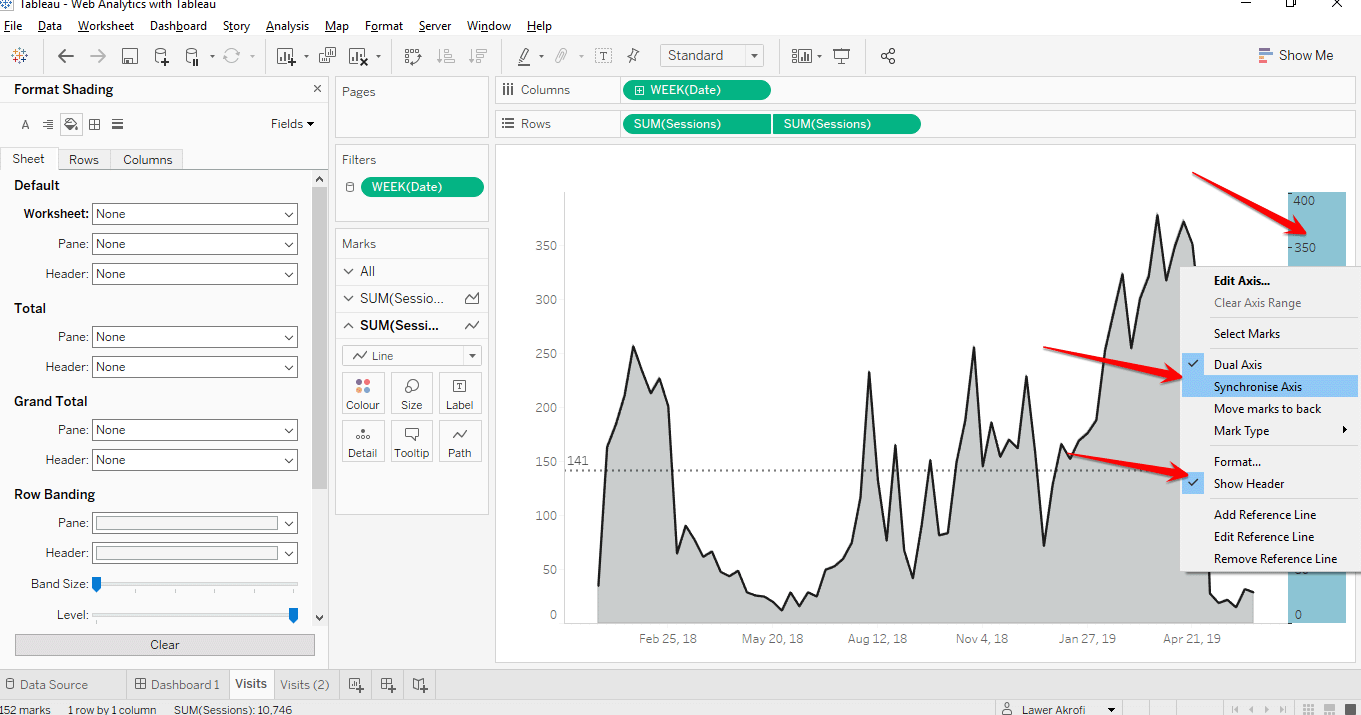
- Your final view should now look as shown below. Rename your Sheet Name from the default "Sheet 1" to "Visits."


Now that you have built the chart, you may also want to add a KPI that gives you some additional information to the chart. For this example, we want to compute the overall number of sessions or visits-to-date. To do that, use a Level of Detail calculation.
- Open the Calculated field editor by selecting the drop-down arrow in the right-side of your data pane (i.e., where you have you dimensions & measures).

- Type in the formula below. Notice the calculation is wrapped in curly brackets { }; this the level of detail calculation mentioned earlier. Using this allows us to show the overall number of Sessions regardless of whether a filter is applied to your chart or not. Note that not all the computations will work the same as below.

- Give the calculation a title. E.g., Overall Sessions. Click OK.
- You can find your new calculation in the Measures pane at the bottom left.

- Drag the Overall Sessions field and place that on the Details shelf, as shown below.

By default, your chart title will display the name of your Sheet. To change this:
- Double-click the title of your chart to bring up the Edit Title menu. Clear out the default title.
- On the right-hand side, click the little arrow on the right-hand side and select the Overall Sessions field.

- You can use the options on the Title Edit menu to format the text the way you want.

- Repeat these steps for all other metrics you want to analyze.
Now that you have completed all your charts, it's time to bring them together into a cohesive dashboard that allows you to see your site at-a-glance. See the example below:
Building Your Dashboard
On the top menu option, select Dashboard > New Dashboard to launch a new Dashboard canvas.

You can also click on the bottom of the Tableau workbook to achieve the same result.
Steps
- Click on the Horizontal Layout container from the Objects section and drag it onto your dashboard canvas.

- From the Sheets section, drag your first Sheet (in this example, Visits) and place it into the container.

- Drag the next sheet and drop it to the right of the Visits sheet. Make sure it is being placed within the layout container. Take note of how the second sheet is highlighted to the right. This tells you that it is within the layout container.

- Introduce the third sheet into the layout container. You view should look like the screenshot below.

Now we want to make sure all the charts or sheets within this layout container are sized correctly.
- Click on any of the three sheets. You will see an arrow appear at the top right of the sheet. In the drop-down menu, Select Layout Container.

- Once the layout container is selected, click on the arrow on the right and in the drop-down menu select Distribute Contents Evenly.

- Drag another Horizontal Container from the Objects section at the bottom left and place it underneath the first one, as shown below.

- Repeat steps 2 to 6 using the next group of sheets.
- Introduce another container and repeat the above steps again until you have all your sheets arranged as shown in the screenshot below.

- At the bottom of your Objects section, select Show dashboard title.


You will notice a container pops up at the top of your dashboard displaying the default dashboard title. Just like the sheet, the default dashboard name will also be the name that displays at the top.
- Double click the title and rename it to Web Analytics Dashboard. You can also double-click the default name (i.e. Dashboard 1) at the bottom of your page and rename it there.
Now that you have built your dashboard, it is time to analyze it for insights and then make improvements based upon your findings. Happy analyzing!
Author: Lawer Akrofi, who holds a master's degree in Business Administration with a concentration in IT Management as well as a bachelors in Economics. Lawer has over three years of experience in visualization and dashboard development and spends his free time contributing to Tableau community projects such as #MakeoverMonday and #DataforaCause.

