When teaching our data science course, we are frequently asked: 'what is Big Data?' There is a lot of interest — and hyperbole — surrounding the topic. For better or worse, we live in a world of ever-increasing data collection. And data is not much use if you don't do anything with it. The techniques associated with Big Data are often presented as a salve for the pain felt when trying scale an analysis method beyond an outdated spreadsheet on an ageing laptop1.
But just what is 'Big Data'? The answer may surprise you!
Most working definitions of Big Data do not have an explicit reference to the size of the data set. This is because the associated conceptual, software, and hardware shifts derive from several important factors aside from actual size of the data. Take the National Institute of Standards and Technology (NIST) definition:
"Big Data consists of extensive datasets — primarily in the characteristics of volume, variety, velocity, and/or variability — that require a scalable architecture for efficient storage, manipulation, and analysis."2
To summarize, here are the so-called Four V's of Big Data:
Volume — size of the dataset
Variety — multiplicity of data types andsources
Velocity — speed of dataretrieval
Variability — change in other characteristics
A combination of these features necessitates an architectural scaling. The processes that come with this scaling are notoriously painful to the newcomer. To understand why, we need to delve slightly into the fun topic of von Neumann3 architecture.
What Is Von Neumann Architecture?
Pretty much all modern computers make use of this architecture, which is a description of how instructions (programs) and data are stored and transferred between processors and memory devices. There are plenty of ways you could conceive of doing this.
Von Neumann had the simple idea of dumping programs and data all on the same memory devices. This is great because you don't have to have all these complicated systems and protocols to retrieve data over specialized communication systems (buses). But, just like an urban transport system, the down-side is that it leads to bottlenecks because of this common bus system.
Using Caches
So, designers of computing systems compromised by creating a hierarchy of memory devices, known as caches.
Like some treasure-crazed buccaneer, the computer stores the most important and recently used items very close to its heart. The memory cache with direct access to the main processor is the fastest. However, because of engineering and cost constraints, it is also the smallest.
When the data required exceeds the cache size, calls are made further down the cache hierarchy until we get to main memory (SDRAM, or just RAM4). By now, data processing is roughly a thousand times slower, but the device can hold a lot more. You're probably aware the main memory of your own computer is currently measured up to tens of gigabytes (GB). Once you start processing data with sizes around this size, you're left with paging your hard disk. Even with very fast solid-state drives, this is now around 40,000 times as slow as the data rate from the fast (L1) cache.
And this is assuming that you are performing very simple operations on your data. Once you need to do anything tricky, the computational complexity increases, meaning you often must perform multiple operations on the same data, which adds up quickly! This increasing complexity is what accounts for the introduction of the other V's. Different activities place very different demands on computational infrastructure.
As you scale further up in volume and/or computational complexity, processing times grow from seconds to weeks to more — assuming your analysis pipeline is robust enough to not crash before then. Nobody has time for this. Depending on the task, you could mitigate some of these effects with hardware accelerators such as manycore processors, GPUs, or FPGAs (or a combination5). But at some point, to avoid being eaten by your own data, you're going to need a bigger boat.
You're going to need to scale horizontally. Congratulations, you've entered the world of Big Data. Make pain your friend. Well, at first anyway.
What Is Horizontal Scaling?
Horizontal scaling refers to the harnessing of numerous discrete computing units ('nodes') and is currently executed in two main ways6. The first involves binding a lot of computers together tightly, with a very fast interconnect or backplane among them, and usually a specialized data serving system, such as a network file system (NFS) or a parallel file-system, such as a RAID7. Each computing node can access the data quickly, and process portions of the data as needed. This High-Performance Computing (HPC, or 'supercomputer') model is used by large-scale scientific projects, such as the Large Hadron Collider (LHC) and the Laser Interferometer Gravitational-wave Observatory (LIGO).
The other popular model of horizontal scaling is to discard a specialized data server and backplane system, in favor of more or less evenly distributing data among relatively loosely bound nodes and processing the data in place. This MapReduce model divides the processing into a map phase, which involves sorting and/or some other filtering scheme, followed by a reduce operation, which is an aggregation on the resulting data. The Apache Hadoop project is perhaps the largest and most accessible implementation of the MapReduce paradigm.
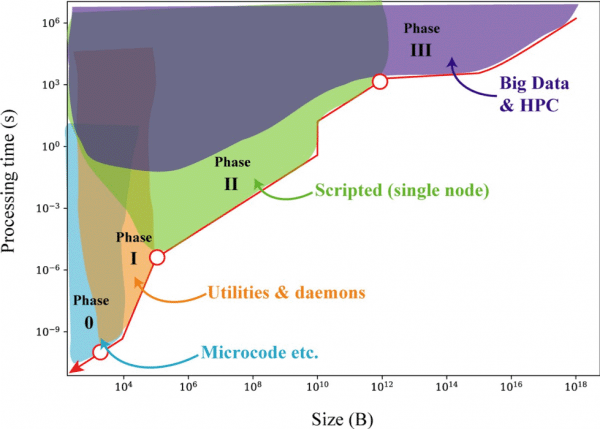
To put all of this in context, it may help to think of the various states of data in terms ofphase transitions. Ice and steam are merely different phases of the same substance, namely water. Yet a steam turbine bears little similarity to an ice-maker. Similarly, the computational machinery surrounding data in its various phases is vastly different:
Figure 1: The phases of data handling. Analogously to phases of matter, the computational machinery surrounding data at different scales looks very different. The numbers are very rough estimates, based on 2018 figures for L1 cache, DDR4 RAM, and high-speed SSDs.
Disclaimer: There are so many caveats to this rough diagram. 'Processing time' is a mixture of data processing rate as well as latency. The transitions (vertical lines) occur when a different memory system is required. The Phase III region assumes a distributed system of a thousand nodes. There are all sorts of tricks and traps that shift the numbers around in practice. For example, a big one in parallel computing (horizontally scaled) systems is Amdahl's Law, which predicts the speed-up — and bottleneck — due to adding a lot of processors. It's the reason for the plateau in the Phase III. Hopefully this provides a mental map of the scale of data processing!
Technically speaking, both the HPC and MapReduce models involve data conforming to the definition given above for Big Data. However the colloquial term — the 'word on the street' — is usually reserved for systems implementing MapReduce and related frameworks.
How Does Apache Spark Fit into Big Data?
You are not alone if you think the map-reduce paradigm is particularly restrictive. In fact, the range of applications is surprisingly broad. However, there are still algorithms that are ill-suited for map-reduce. This is a major criticism of the original Hadoop framework. For this reason, the Apache Spark project has emerged as a popular solution. Spark builds on the Hadoop architecture, but, instead of merely sharing data across hard-disks, it provides an interface to distribute datasets and data models among the much faster RAM memory of the nodes. This opens the possibility to re-use computational resources in a way that is difficult within the map-reduce framework (for example, non-trivial iteration).
So, now that you know what Big Data is, we end here with a note of caution. Because there is so much excitement surrounding this technology, many people and businesses are keen to embrace it as a hopeful cure-all for their data woes. However, you can probably already infer from this discussion that there is a fair amount of overhead required. If your data infrastructure is not mature and automated enough, then the promise of Big Data will fizzle into the thin atmosphere — probably along with your valuable time and/or hard-earned money!
And more data is not necessarily better. Systematic biases will scale with the data. As the old saying goes: 'garbage in, garbage out'. You're just left with a lot more garbage.
Although we joked earlier about using a spreadsheet for analysis, many vendors are making huge strides in this area. Indeed, the most popular spreadsheet around, Microsoft Excel, now has an interface to data stored on the Hadoop File System (HDFS) via Power Query. The open source languages Python and R not only each have packages that directly interface with Hadoop and Spark, but also they have plenty of optimized and parallelizable packages such as dask or data.table that can handle an astounding amount of data with a range of structures.
The future is Big. How big? Hopefully you now know.
1 Nothing against spreadsheets — when they're the appropriate tool for the job at hand. Nothing against aging laptops either.
3 John "Johnny" von Neumann, one of the greatest mathematicians of the 20th century, loved dirty limericks, loud music and bad driving. A key figure in the Manhattan Project, he either invented, or helped establish, the fields of quantum mechanics, game theory, mathematical economics, and digital computing.
4 Random Access Memory. The nomenclature comes from the premise that the memory is flexible, holding instructions and/or data as needed, without a preconceived structure.
Ra is originally from New Zealand, has a PhD in physics, is a data scientist, and has taught for Accelebrate in the US and in Africa. His specialties are R Programming and Python.